Articles | Photoshop blog | Photography blog | about me | e-mail

Helen Bradley - MS Office Tips, Tricks and Tutorials

I'm a lifestyle journalist and I've been writing about office productivity software for a long time. Here you'll find handy hints, tips, tricks, techniques and tutorials on using software as diverse as Excel, Word, PowerPoint, Outlook, Access and Publisher from Microsoft and other applications that I love. My publishing credits include PC Magazine, Windows XP mag, CNet, PC User mag, SmallbusinessComputing.com, Winplanet and Sydney Morning Herald.

Monday, November 19, 2007

Excel charts - create an overlapping series


Sometimes an Excel chart will look better if your series overlap - this might be the case when you are comparing data from two years and where you want to show how the values have increased from one year to the next.

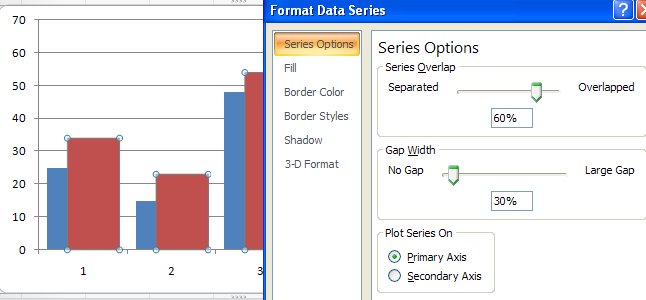
To make your series overlap in Excel 2007, select one series, right click and choose Format Data Series. Click the Series Options and decrease the Gap Width (it closes the chart up nicely) and incease the Series Overlap. Set the Series Overlap to around 60% and the Gap Width to around 30% for a good result. This is particularly useful when you are using images in place of colors for the bars of your chart but works in almost any situation.

Labels: , , , ,

Add to Technorati Favorites

Wednesday, November 7, 2007

In-cell charting in Excel 2007

For a long time Excel users have wanted a way to plot a bar showing the relative magnitude of a range of numbers without having to resort to a chart or complex formulas to do this.

Now, with Excel 2007 this feature is now built in and dead easy to use. To try it out, first type a series of numbers in a column, then select the series. Click the Home tab and click the Conditional Formatting button.

Select Data Bars and then select the color of the bar to use. The relative length of each colored bar indicates the relative value of the number in that cell.

There is one caution, however. All values - even very small values will be given a minimum bar length of 10% so they can be seen - so, use this feature as a guide and not an accurate measure.

Labels: , ,

Add to Technorati Favorites